Micro Interglacial Cycles and an Alternative Understanding to Sea Level Fluctuations from a Paleoclimatic Perspective the Last 140,000 Years
August 22, 2019
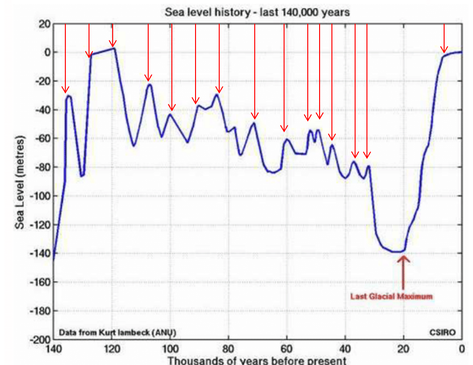
It is often theorized that the current moderate temperature anomalies are leading to abnormal or paleoclimate significant increase in sea level rising. MOTM does not deny the fact the sea level is increasing at moderate levels. But from a paleoclimatic perspective the current sea level rise is relatively stable and changing much slower than the previous 140,000 years. From a paleoclimate perspective the current sea level is 20 meters lower than the previous interglacial sea level peak 130,000 years ago known as the Eemian. Moreover, the sea level had chaotic rises 20,000 to about 10,000 years ago that dwarf our current sea level change.
“In fact, the rise and fall of sea level is not a new issue for mankind although it has become one of the most heated topics recently. For example, during the last ice age, sea level fell to more than 120 m below present day sea level as water was stored in ice sheets in North America (Laurentian, Cordilleran), Greenland, Northern Europe (Fennoscandia and the Barents region) and Antarctica. When the ice melted, starting around 20 000 years ago, sea level rose rapidly at average rates of about 10 mm yr-1 (or 1 m per century), and with peak rates of the order of 40 mm yr-1 (or 4 m per century), until about 6000 years ago (Church et al., 2001).”
Also please read our Articles
NOAA shows a modest 3.2 mm sea level rise over the last year. How significant is the current sea level raise from a geological perspective?
Increasing Summer Insolation of the Northern Hemisphere Trends Towards Reduced Ice Volume; Coupled by a 400,000 year Eccentricity Cycle Extending the Holocene Interglacial
Micro Interglacial Cycles
When scientists and policy makers debate the significance of the current sea level change they often use statistical data postulated on an idea that the current interglacial is in stasis state that represents an unmoving equilibrium. However, MOTM would like to point out there are about 15 sea level rises and reciprocal level drops that happened the last 140,000 years that exceeded a sea level change of 1 meter per century or more for a duration of greater then 2,000 years. These constant increase and drop in the sea level rise can also be referred to as micro interglacial cycles.
When scientists and policy makers debate the significance of the current sea level change they often use statistical data postulated on an idea that the current interglacial is in stasis state that represents an unmoving equilibrium. However, MOTM would like to point out there are about 15 sea level rises and reciprocal level drops that happened the last 140,000 years that exceeded a sea level change of 1 meter per century or more for a duration of greater then 2,000 years. These constant increase and drop in the sea level rise can also be referred to as micro interglacial cycles.
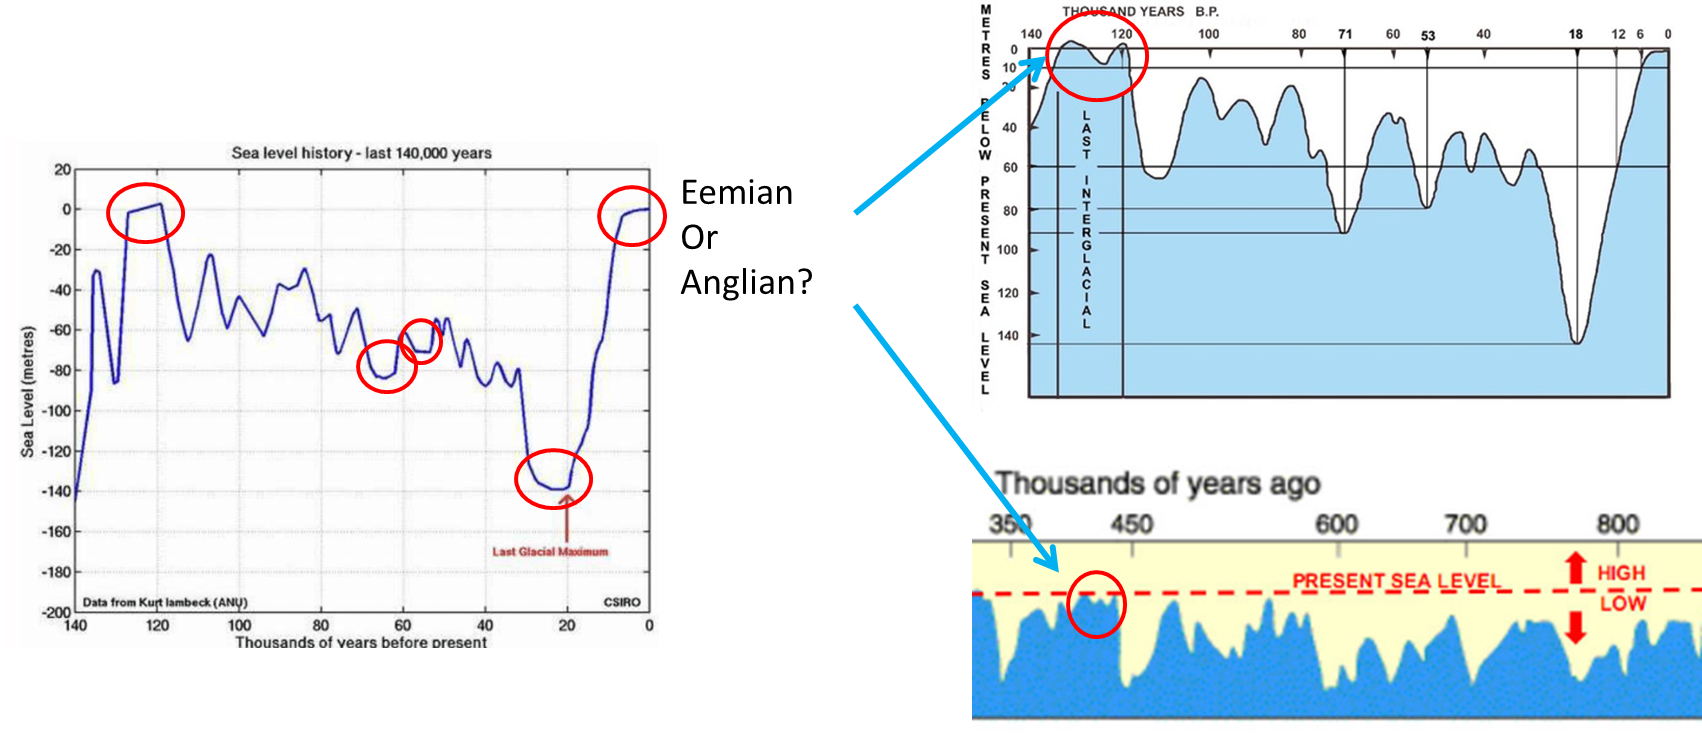
The current sea level stability has not been this close to stasis except for two previous periods after the Eemain interglacial(130kya-115kya); 62,000-71,000 years ago, 52,000 to 58,000 years ago and at the Glacial Maximum about 20,000 to 30,000 years ago. The current sea level increase is roughly about 3 mm per year or about 8-12 inches a century. Based on CSIRO 2010 sea level graph below the current sea level change rate is speculated to be most similar to roughly 25 percent of the time from the post Eemian Interglacial starting point of 115,000 years ago. MOTM speculates that the sea rise and fall rate during the dozen or more micro interglacial cycles between the Post Eemian (115kya) and Holocene Interglacials(present) came close to or succeeded one meter a century about 50 percent of the time. These rise and falls of the micro interglacial cycles each lasted on average from 2,000 to 8,000 years. This rate of change in sea level when compared to current sea level change rate is estimated on average to be about 300% higher. It appears that the current sea level change rate is significantly less then 50% of the time. This is actually a remarkable feat concerning that the Eemian interglacial was slightly a warmer period and the Sea Levels reached 20 feet higher and around 1 to 2 degrees Celsius (1.8 to 3.6 Fahrenheit) warmer than that of the Holocene temperatures. Furthermore, the Arctic region was about 2-4 °C higher than today.
Including current sea level stasis there are at least four previous sea level stasis events that were similar to current sea level change rates during the last 140,000 years. These sea level stasis events are theorized to have a duration range from 5,000-10,000 years. The current stable sea level rate change started about 7,000-8,000 years ago. In all of the previous sea level change rate pauses or stasis; these stasis pauses are preceded and followed by sea level change rates of one meter per century or higher. These rates would be 300% to 1,200% higher than the current rate. Though it is almost impossible to know for sure without diving deeply into empirical evidence and research to understand micro glacial cycles; but it does appear that the sea levels in a prolonged stasis, including the current one, of more than 5,000 years happen happen roughly only 25% of the time in the last 115,000 years. Based on this graph below there is a 95% estimation that the current sea level will increase or decrease by over one meter a century for several thousand years or more sometime within the next 2,500 years regardless of Anthropocene effects contributing to the Glacier Cycle.
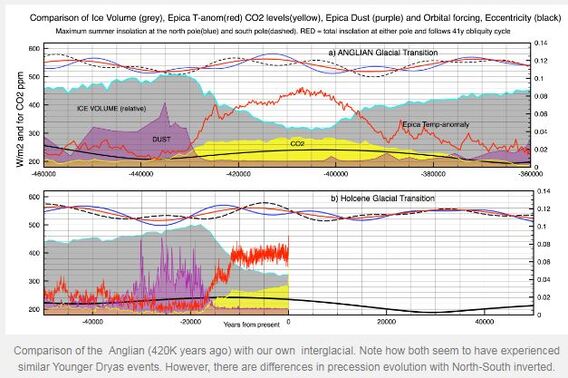
However, it is quite possible that the current sea level stasis event could be experiencing a nano interglacial event or more reflective to orbital eccentricity cycles. If the current interglacial is more similar to Anglian Interglacial cycle it is quite possible the Holocene may last another 10,000 years with slight warming and increase in sea level.
“Eccentricity is important because it regulates the strength of polar maximum summer insolation caused by precession of the equinoxes every 21,000 years. Precession determines the distance from the sun during a Polar summer. If summer coincides with the earth’s perihelion then summer insolation can be up to 20% higher than average. However if the earth’s orbit is nearly circular, as it is today, then precession has little effect at all. That is why we have about 12000 years left before cooling begins.” October 4, 2016 by Clive Best, When is the next ice age due?
Please Read MOTM Article
Solar Forcing Comparison Between the Holocene and Anglian Interglacial Periods Related by Eccentricity
Nano Interglacial Cycle
The Nano Interglacial Cycle can be called a period of time within a Micro Interglacial Cycle that last close to 100-1000 years such as the medieval warming period or younger dryas. The Nano Interglacial Cycle can be described as significantly accelerating or decelerating a paleoclimate Interglacial Cycle directions inertia.
Micro Interglacial Cycles Off the Coast of Florida
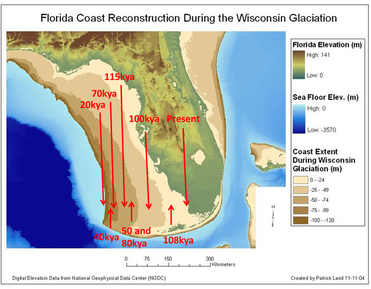
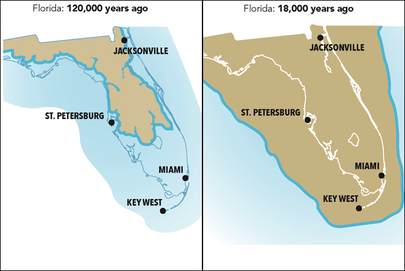
MOTM ran some very rudimentary speculative numbers on the movement of the Florida Coast line over the last 115,000 years. As you look below we show a map with the rough estimate locations of the coast lines along the southwest part of the panhandle of Florida 115kya, 208kya, 80kya, 70ya, 50kya, 40kya, 20kya, and present. The next map shows the estimated Florida coast line 120kya years ago during the Eemian Interglacial and 18,000 years ago during the Glacier maximum.
MOTM ran some very rudimentary speculative numbers on the movement of the Florida Coast line over the last 115,000 years. As you look below we show a map with the rough estimate locations of the coast lines along the southwest part of the panhandle of Florida 115kya, 208kya, 80kya, 70ya, 50kya, 40kya, 20kya, and present. The next map shows the estimated Florida coast line 120kya years ago during the Eemian Interglacial and 18,000 years ago during the Glacier maximum.
The first map gives the viewer a general idea how much the coast of Florida moved inland our outland during the dozen or so micro interglacials. The three largest movements of the coast line from the last 115,000 years was the post Eemian Interglacial, Glacier Maximum, and Holocene Interglacial (present). During Holocene Interglacial melt it is estimated that the coast line of Florida moved inland 300km over 10,000 years or roughly 3 km per century. Using very basic and speculative data we theorize that the lower southwest panhandle of the Florida Coast was moving inland or outland at a rate of 2 kilometers or greater per century 50% of the time the last 115,000 years. These numbers do not take into count of the uniformity of the elevation of the land in southern Florida or Subsurface coastal plain. In some places the subsurface or terrestrial gradient is steep. For instance, a one meter raise in the sea level might change the coast at a more rapid in the lower interior of Florida due to uniform distribution of the elevation across the terrestrial plain. MOTM simply devised these illustrations and maps so that the party of interest can develop a clear picture on how variable the sea level change has been the last 115,000 years. MOTM estimates that there is 95% chance that the Florida Coast line in the Southwest Panhandle will start move inland or outland at one meter per century or 2 kilometers per century within 5,000 years without even considering Anthropocene influence unless the current interglacial persist and mirror the Anglian Interglacial. This shrewd speculative analysis shows that after there has been a prolonged stasis in sea level change of about 5,000-10,000 years in length it is followed by an increase or decrease of the seal level at a rate of a meter or more per century.
Micro Interglacial Cycles and Reef Building Corals Migration
Not to mention that interglacial and micro interglacial cycles may play important role in the evolution of life as we know. It is hard to measure and weigh when science, in it’s infancy, and human kind’s recorded history is less then 5,000 years old. It is truly remarkable to think that all life in the upper Northern Hemisphere evolved with such radical changing environments in contrast to our current climatic environment. Along those lines, just think, reef building corals average depth is 18-27 meters in depth. One may summarize an reasonable speculation that entire coral reefs were being completely killed by depth of the ocean, temperature change of sea, or exposed to a dried element almost roughly every 20,000 years over the last 115,000 years. With partial and half die off events every 5,000 years.
Please Read MOTM Article
Glaciers or Rising Oceans; Damned if you do, damned if don’t, And maybe both
Paleohydrological events from the late Pleistocene to the Holocene 30kya to 1500AD
Once again MOTM would like to thank you if you made it all the way through the Article.
As a disclaimer we do not deny there are anthropocentric effects on the globe or increases in carbon dioxide. Many of our graphics and speculative number crunching is geared only to spur debate and discussion on subject matter. We would like to open future discussions on the Nano Interglacial Cycles and The Effects of Dust on Interglacial Cycles.
Nano Interglacial Cycle
Medieval Warming Period
"During the Medieval Warm Period, wine grapes were grown as far north as England, where growing grapes is now not feasible and about 300 miles (500 km) north of present vineyards in France and Germany. Grapes are presently grown in Germany up to elevations of about 1800 ft (560 m), but from about 1100 to 1300 AD, vineyards extended up to about 2500 ft (780 m), implying that temperatures were warmer by about 2–2.5°F (1–1.4°C). Wheat and oats were grown around Trondheim, Norway, suggesting that the climate was about 2°F (1°C) warmer than present (Fagan, 2007)"(Medieval Warm Period)
Enjoy the MOTM Video below on Orbital Variations Effects Interglacial Climate Behavior!!!


